Working in the B2B space, a lot of projects can be simply broken down to "How do we communicate this complex data to our user?". What's fascinating is that the solutions have never evolved. We can't seem to shake off bar graphs and spreadsheets. We fear what lies beyond.
Thankfully what lies beyond is just complex, data rich, well-designed data visualizations that communicate actionable stories to users. I designed Hawthorne's ad campaign platform to help users digest higher quality data and make smarter strategic decisions faster.
My Role
I was the lead designer and product team lead at Hawthorne during the height of COVID. I navigated the team through ambiguous asks and massive, unforeseen tech constraints — all while designing our new platform end to end.
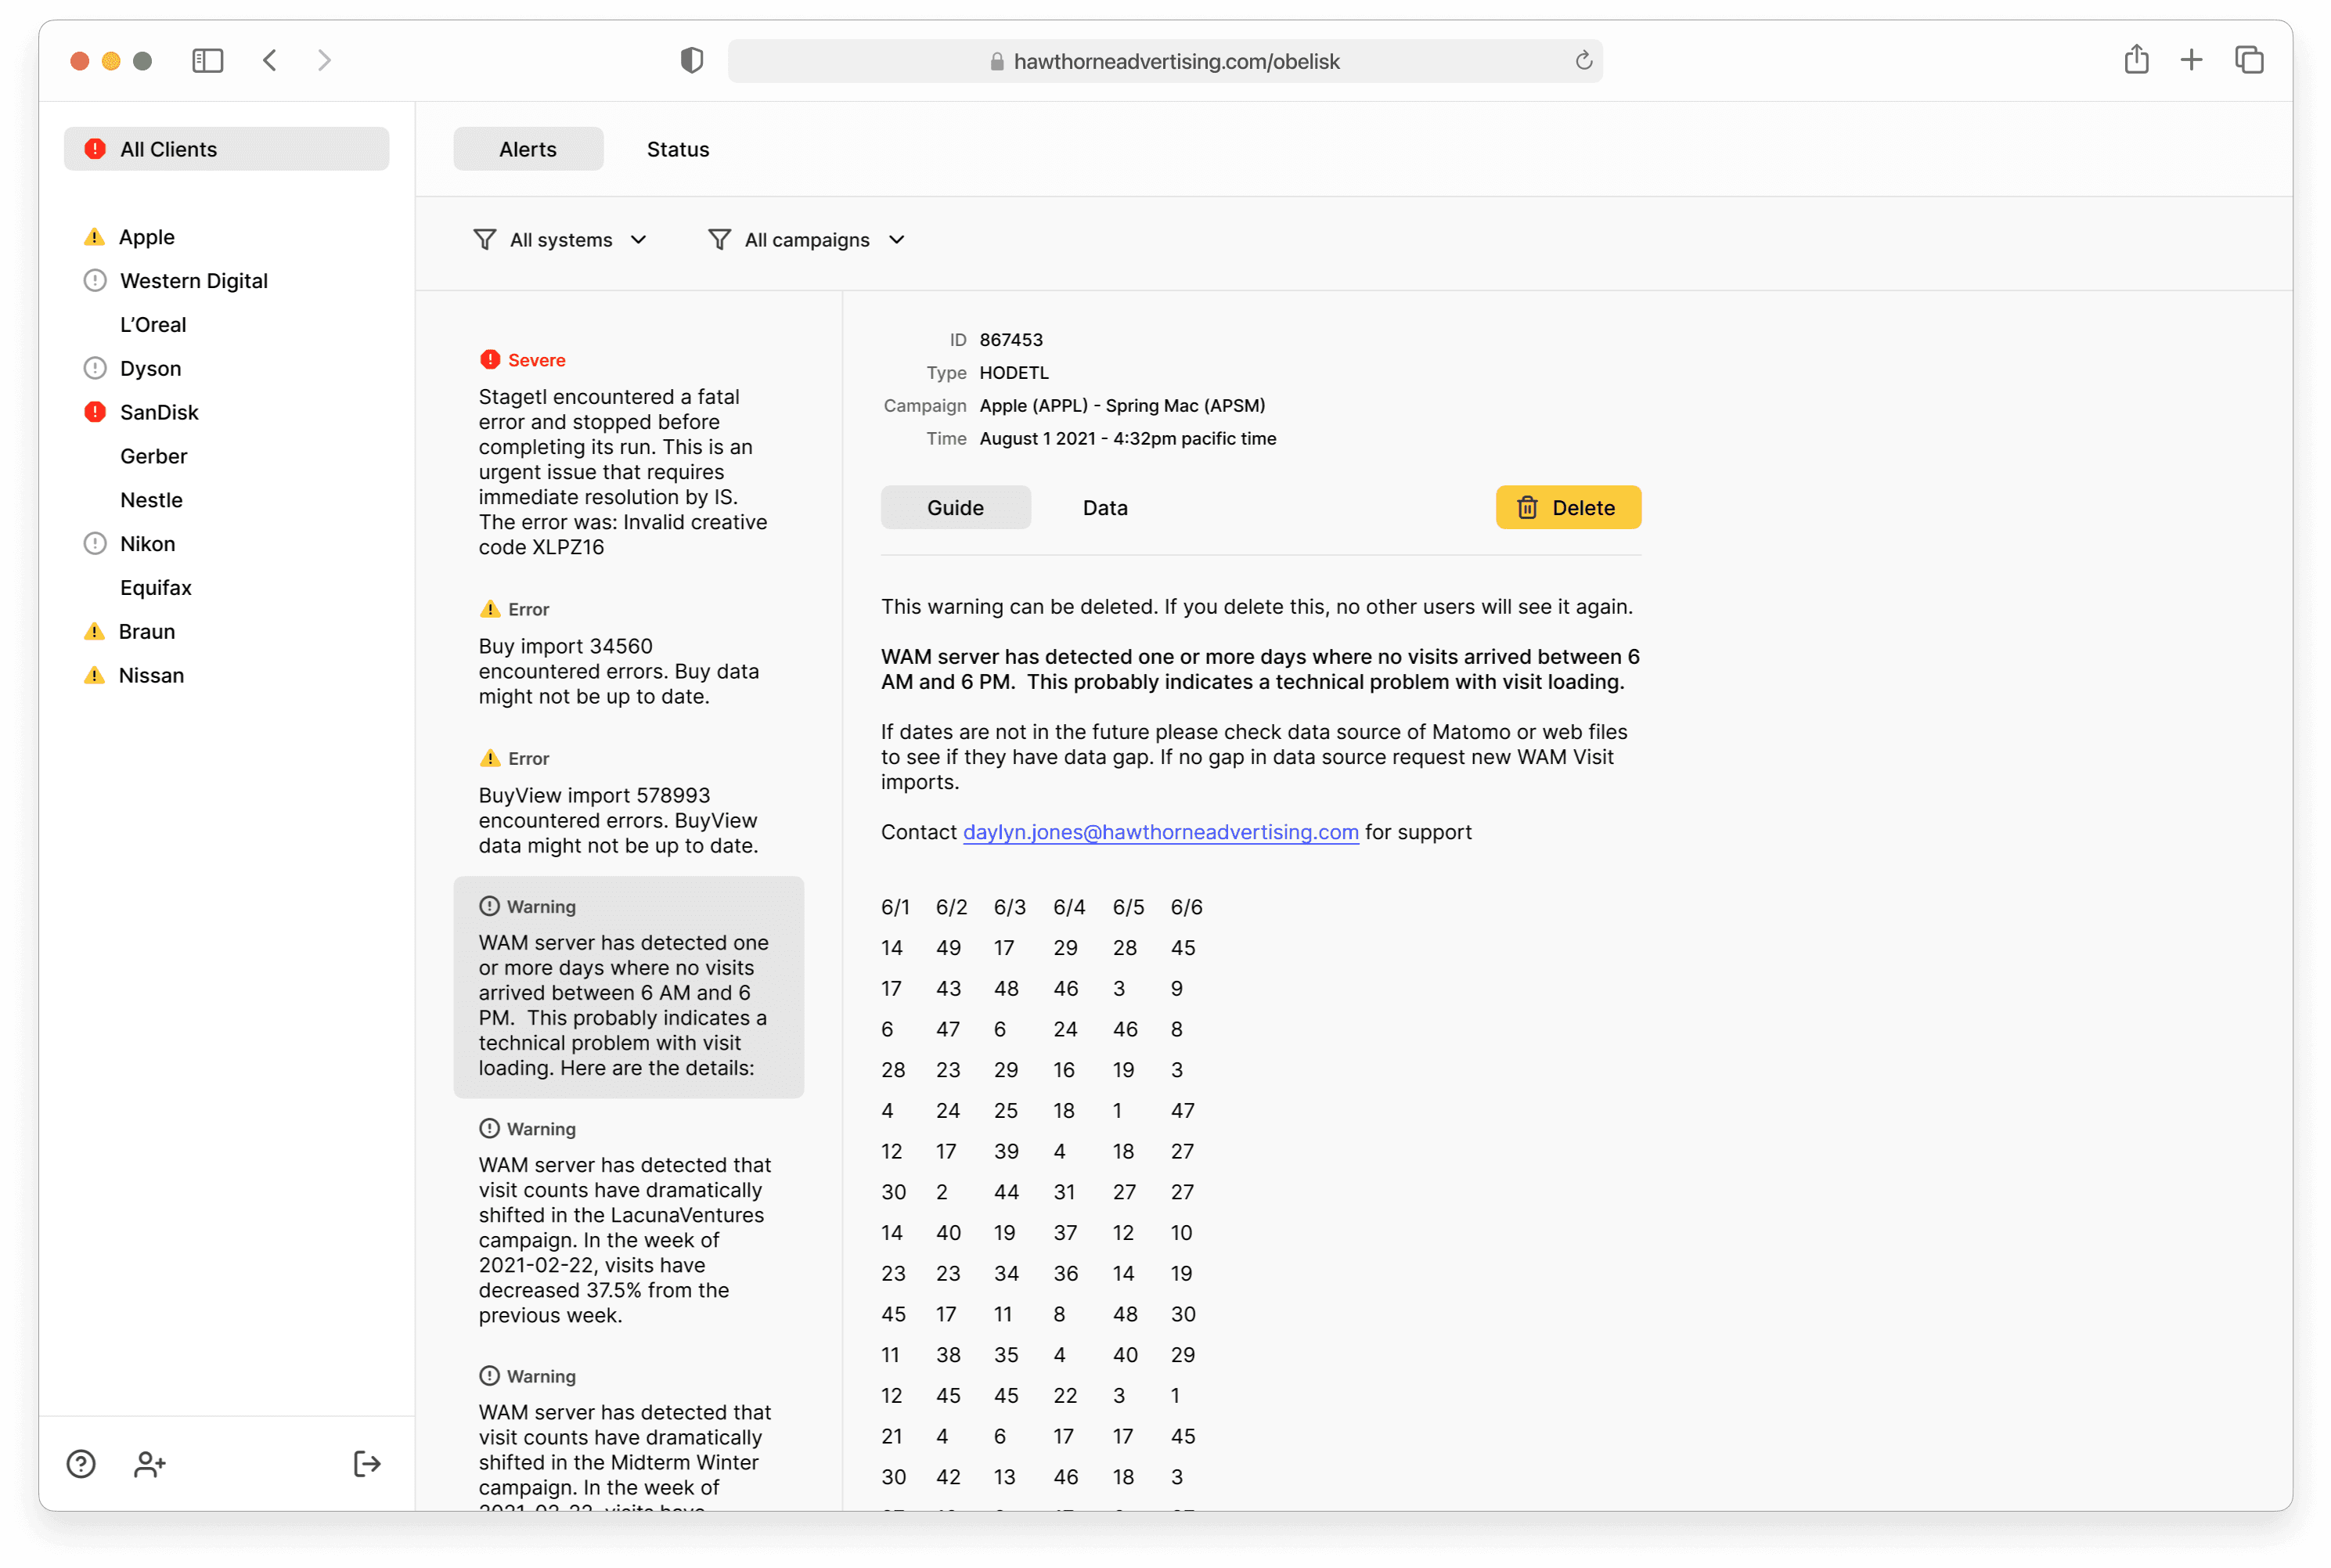
Although the platform was built for ad and marketing professionals, I also had to be considerate of the people molding the data on the platform. Data scientists, account managers, and engineers use it daily in various ways. It wasn’t too difficult juggling the needs of all our users, since it’s something we were conscious of from the start.
Our goals were centered around three objectives:
Deliver visually “sticky” client presentations
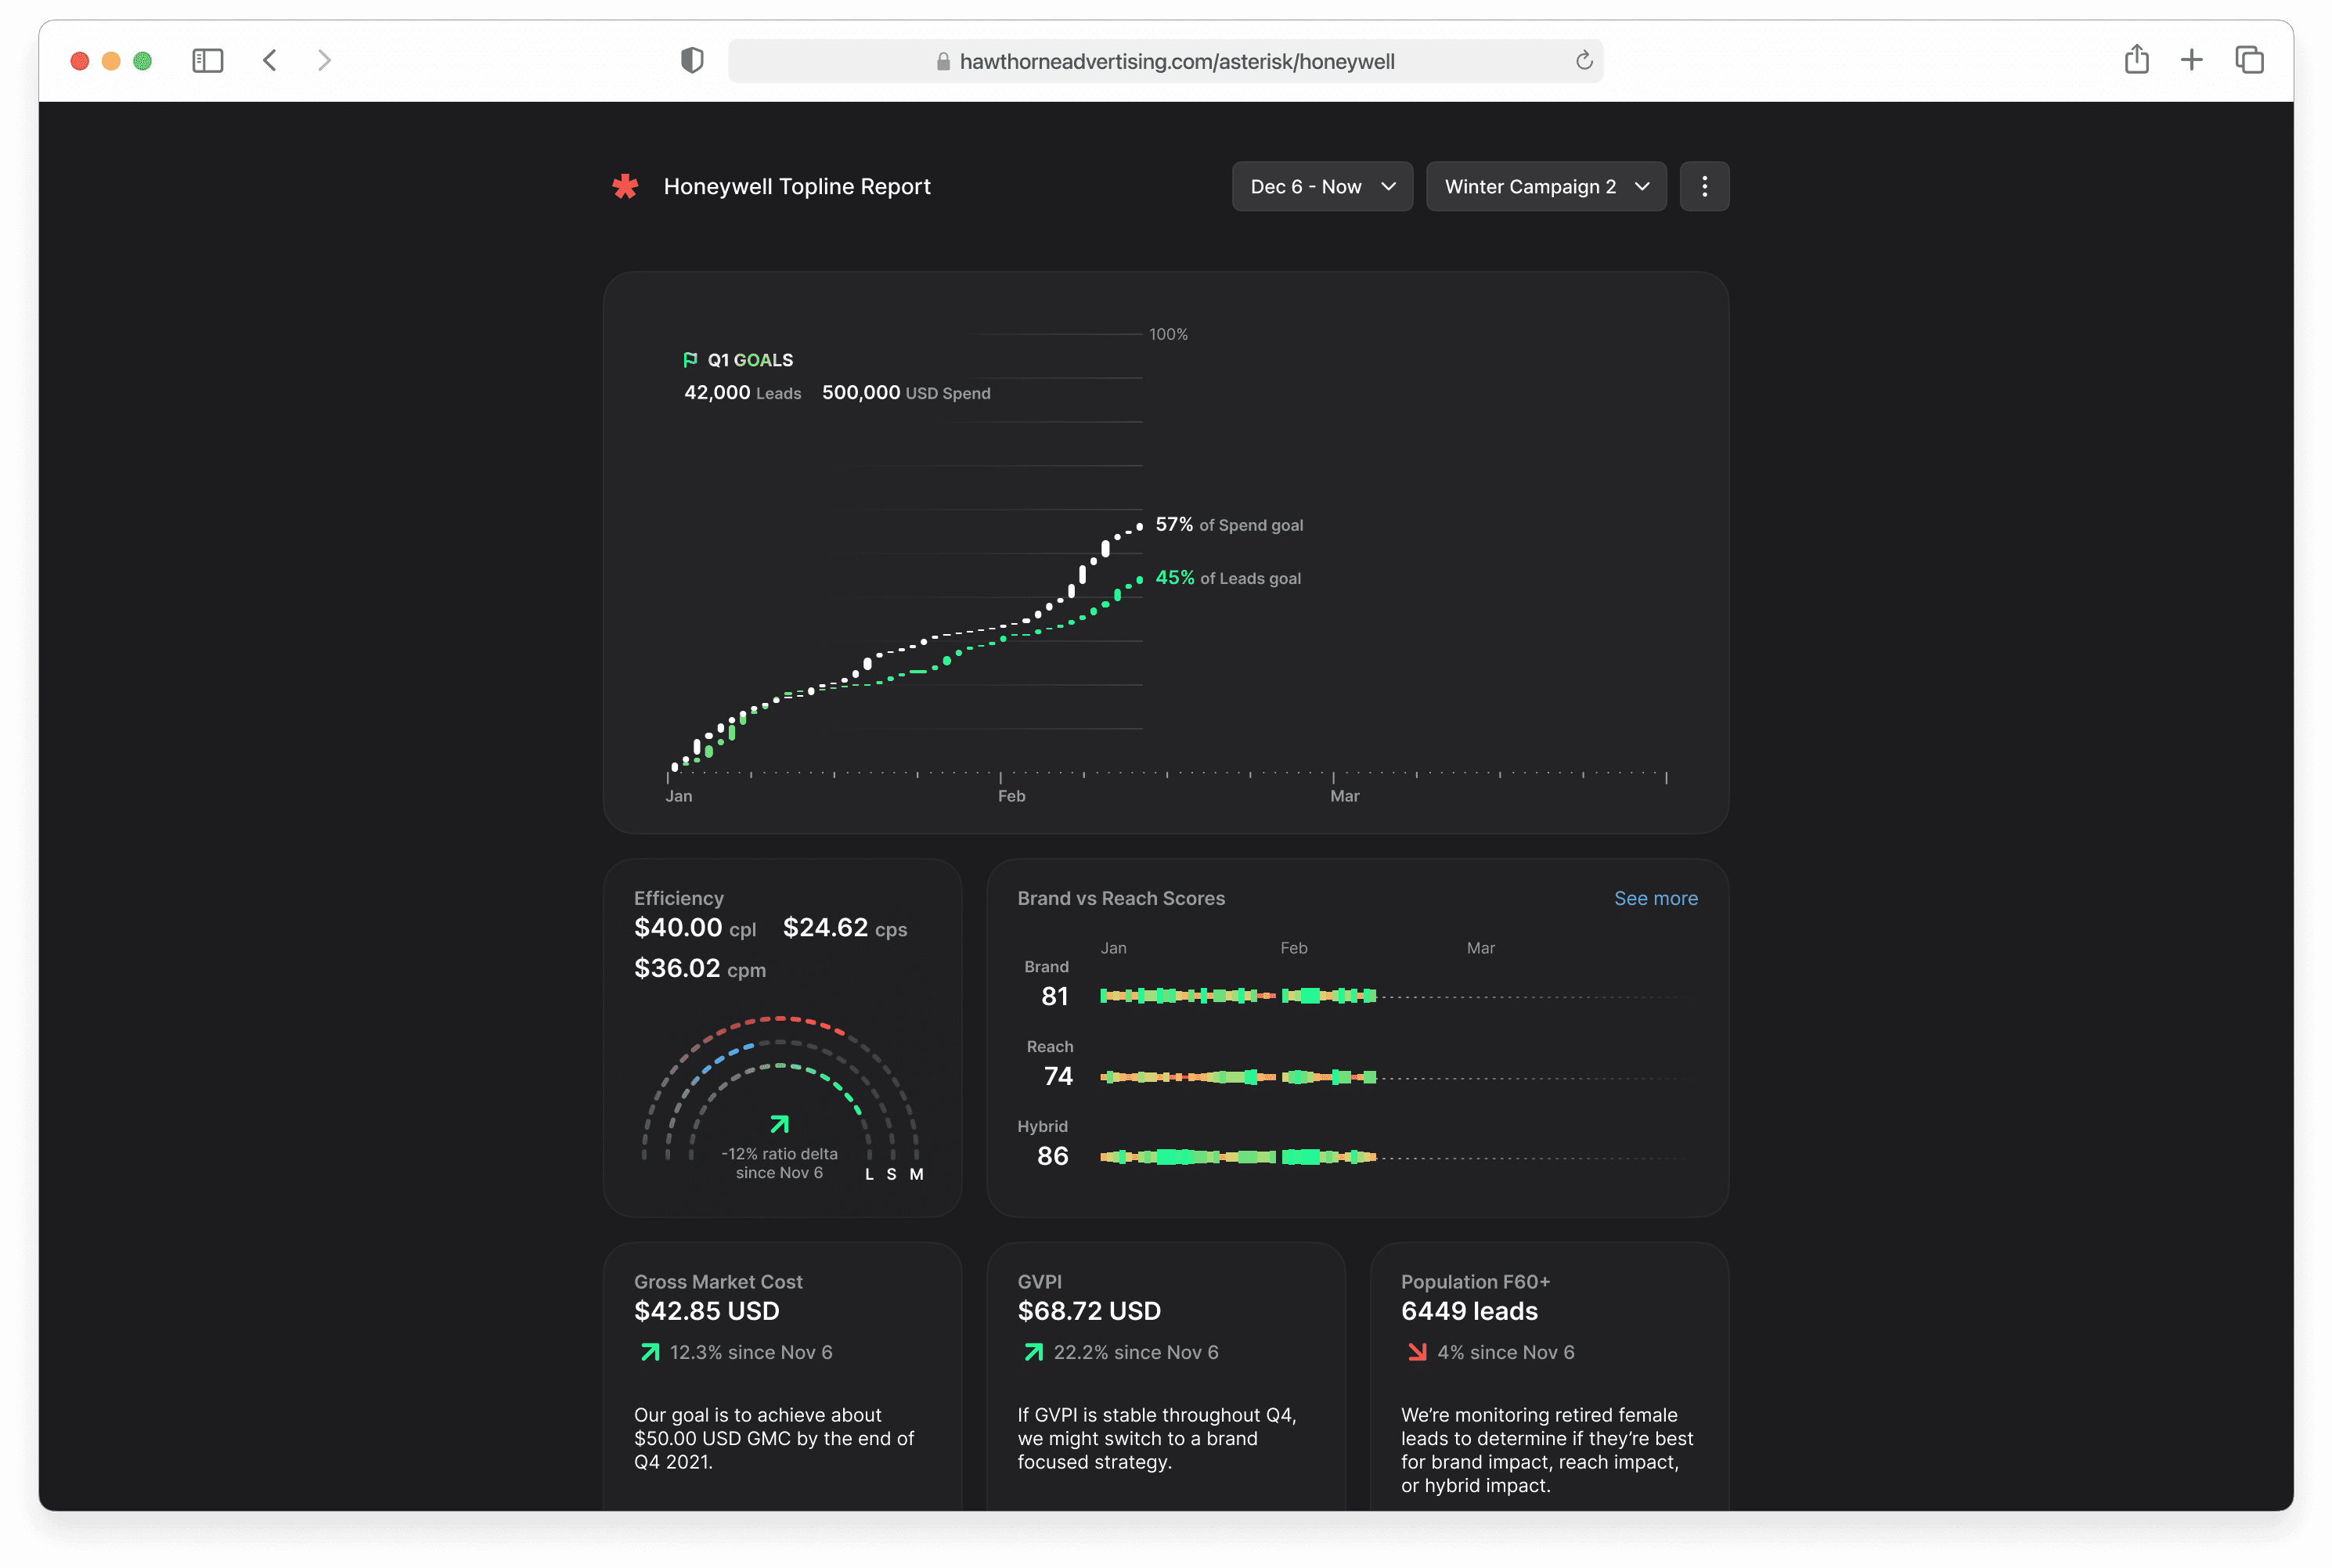
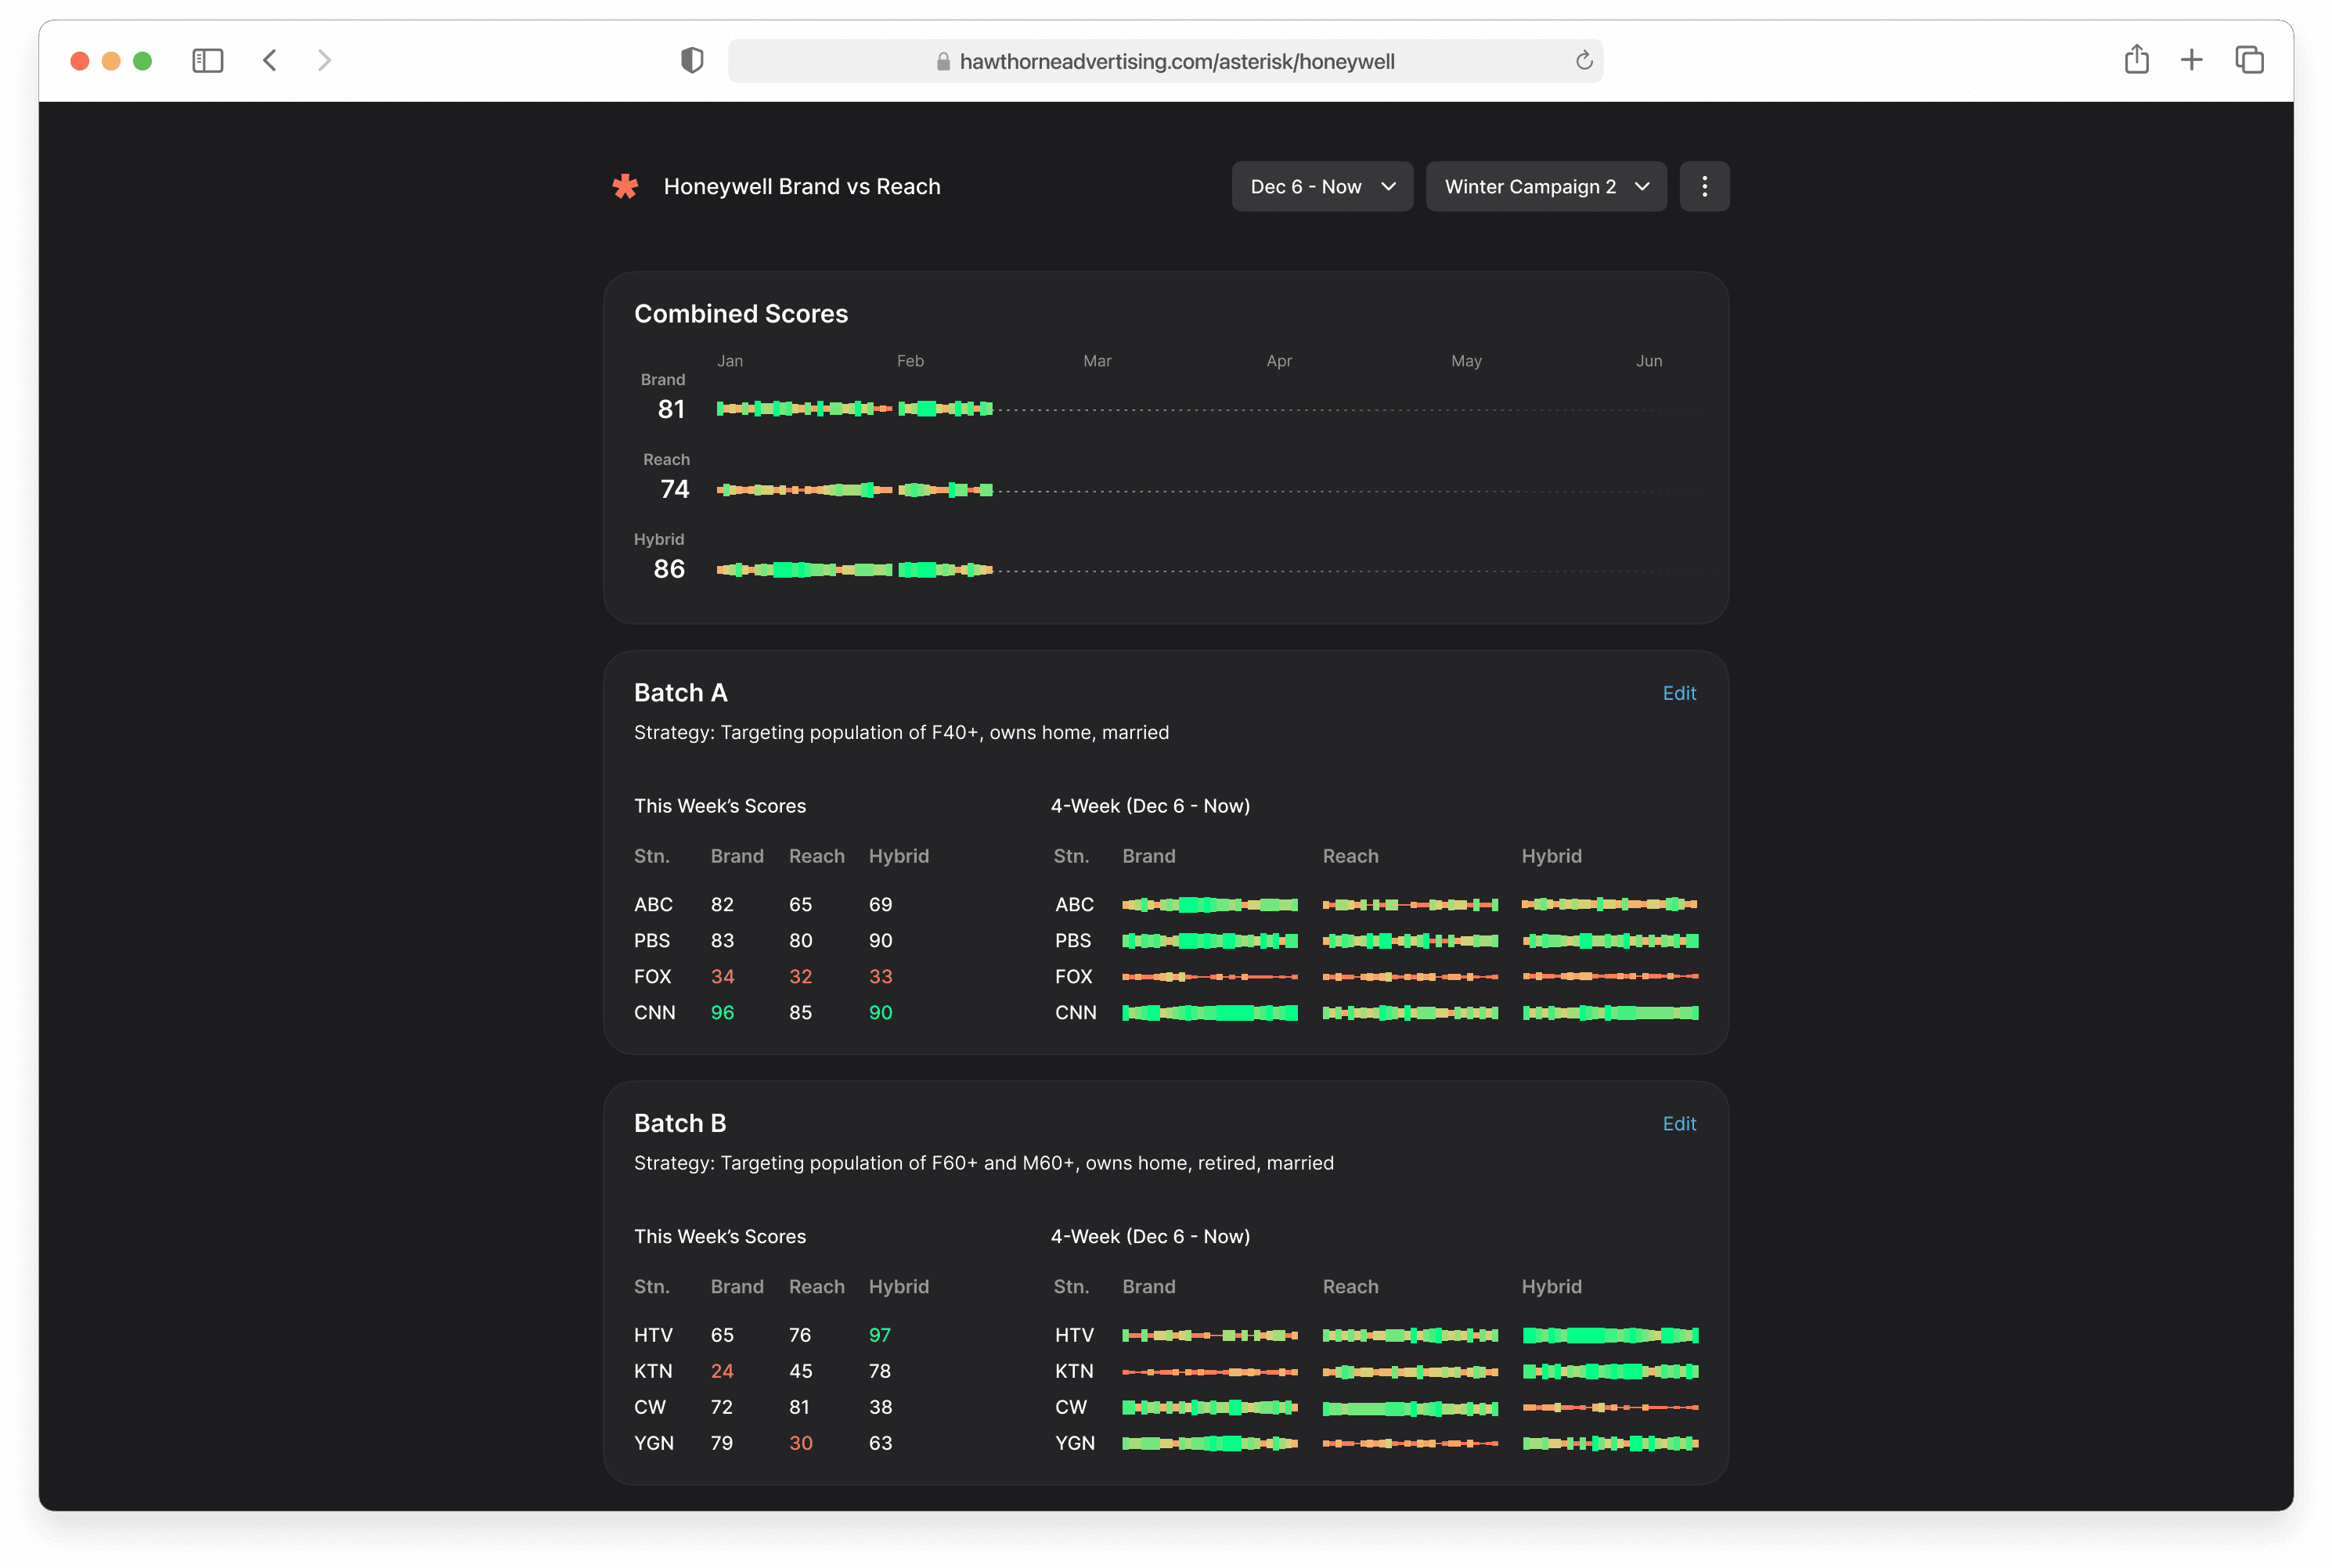
Surface meaningful insights through smart, high-density data visualizations
Modularize dashboards to adapt to varying client needs and campaign types
A platform that communicated ad data at this caliber had never existed. I embedded myself in meetings between clients and account managers to understand everyone’s mental models and pain points. Interestingly, there was a big gap between what our clients wanted to see and what our systems could surface.
I brought these new insights to our account managers and data scientists and asked them to participate in workshops to help me design data viz for the platform. At first, I could tell they didn’t like that I was asking them to do my job for me, but they came to appreciate that their expertise was crucial to the success of the platform. In fact, the workshops would last an extra hour at times because they couldn’t stop designing.
Ultimately, our infrastructure just couldn’t support the key metrics and narratives we wanted to tell. I brought in the business analytics team and our engineers to create new composite KPIs that unlocked value for our clients without any backend overhauls. It worked.
Although this KPI was universally beneficial for all our clients, we prided ourselves on our bespoke services. I designed a modular UI system inspired by Apple’s watchOS. The account managers had fun customizing screens for each client instead of writing up spreadsheets. It also gave us the benefit of removing broken KPIs with minimal setbacks if our backend was struggling.
Throughout the process, I constantly ran tests on two clients during meetings with our account managers: Honeywell and Angie’s List. I was measuring three things:
Are the meetings shorter?
Is the quality of discussions improving?
Are clients asking fewer clarifying questions?
Meeting times dropped by up to 50%. Clients spent less time interpreting dashboards and more time discussing strategy. We met our platform adoption goals as well, so it was all a resounding success.